Geneious Biologics provides an easy method of generating customised reports from your analysis results.
Creating a Report
Reports can only be created from an "Annotated Result", which includes result documents created by the Antibody Annotator, Single Clone Analysis, Scaffold Annotator or Recluster pipelines. Within the Sequence Table viewer of an Annotated Result there is a Generate Report button which will open up a new dialog.

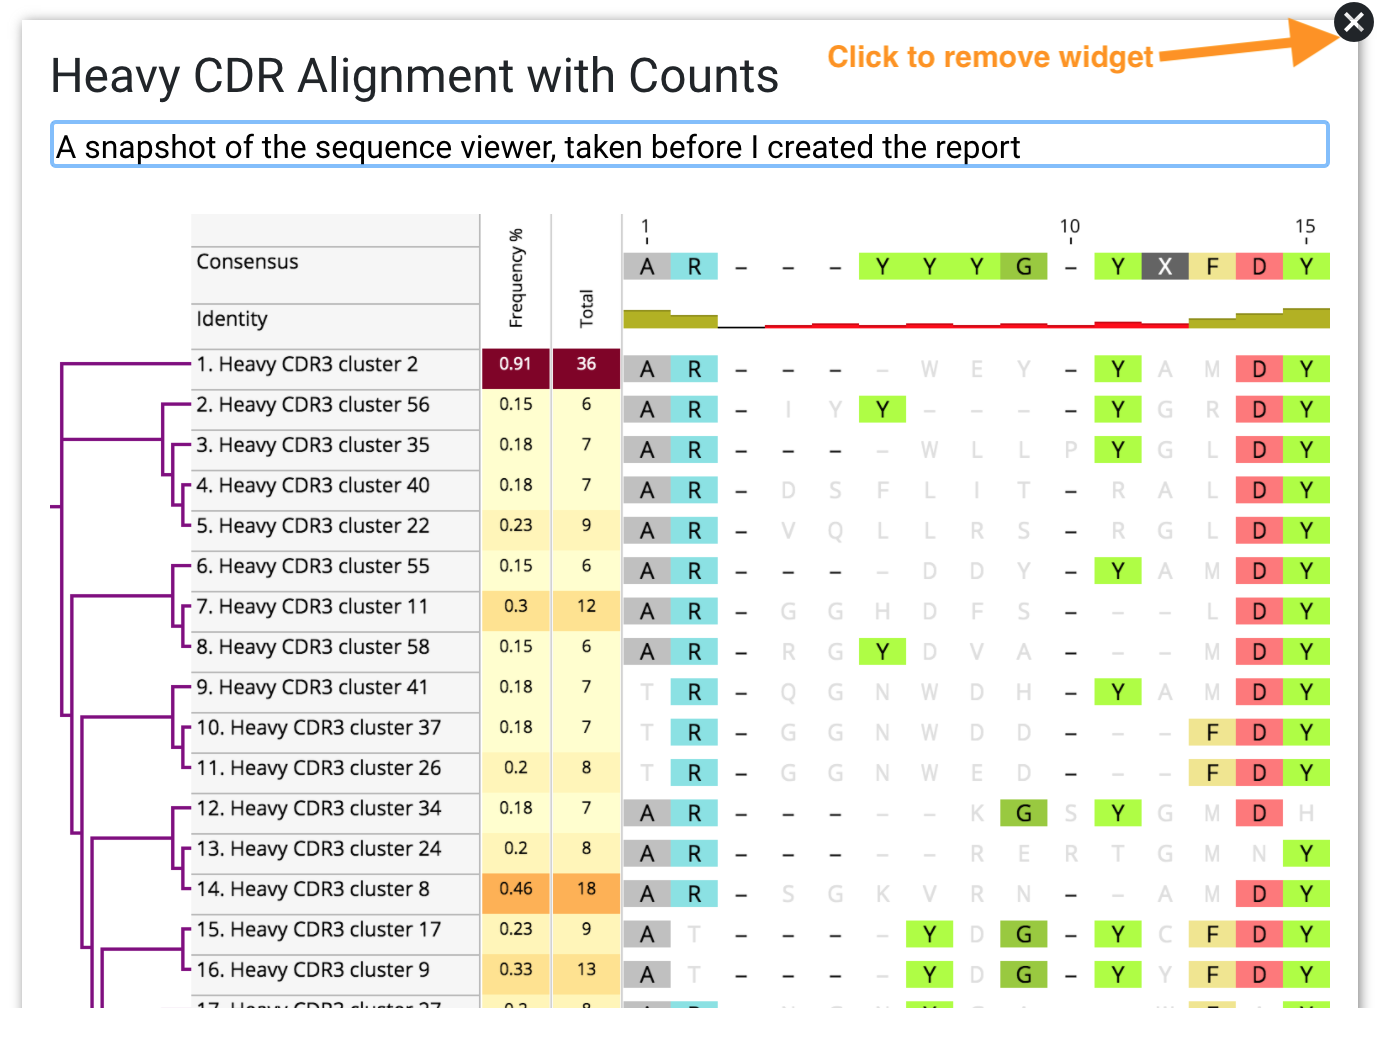
From the Generate Report dialog you can build your own custom report via the Widgets panel on the far right. Widgets could be graphs, tables, or images, and will appear in the report in the order that you add them. Widgets can also be removed using the cross icon in the top corner of each widget if you change your mind.
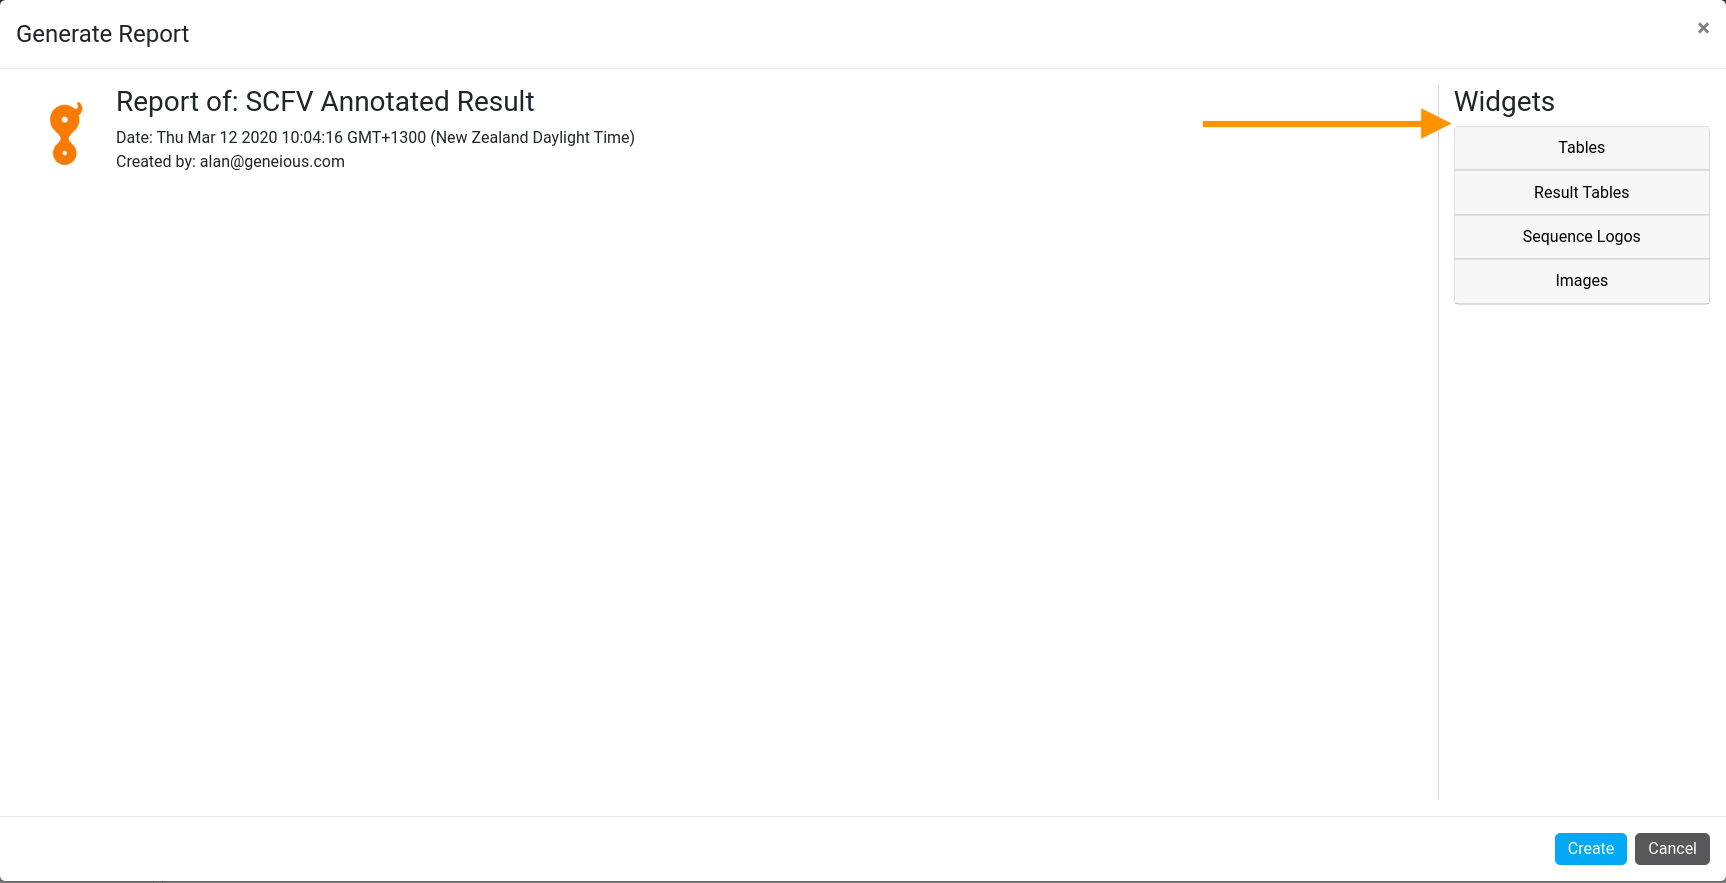
You can edit the name and descriptions of each of the widgets, as well as the report title.
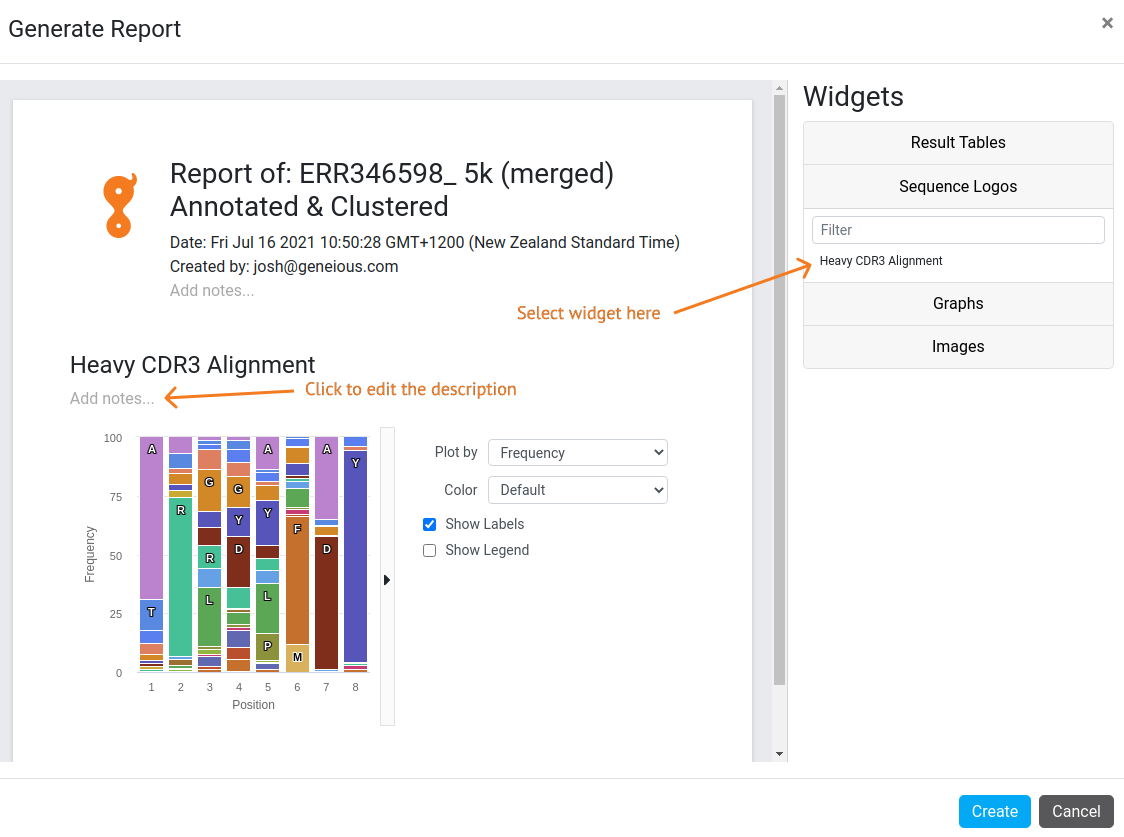
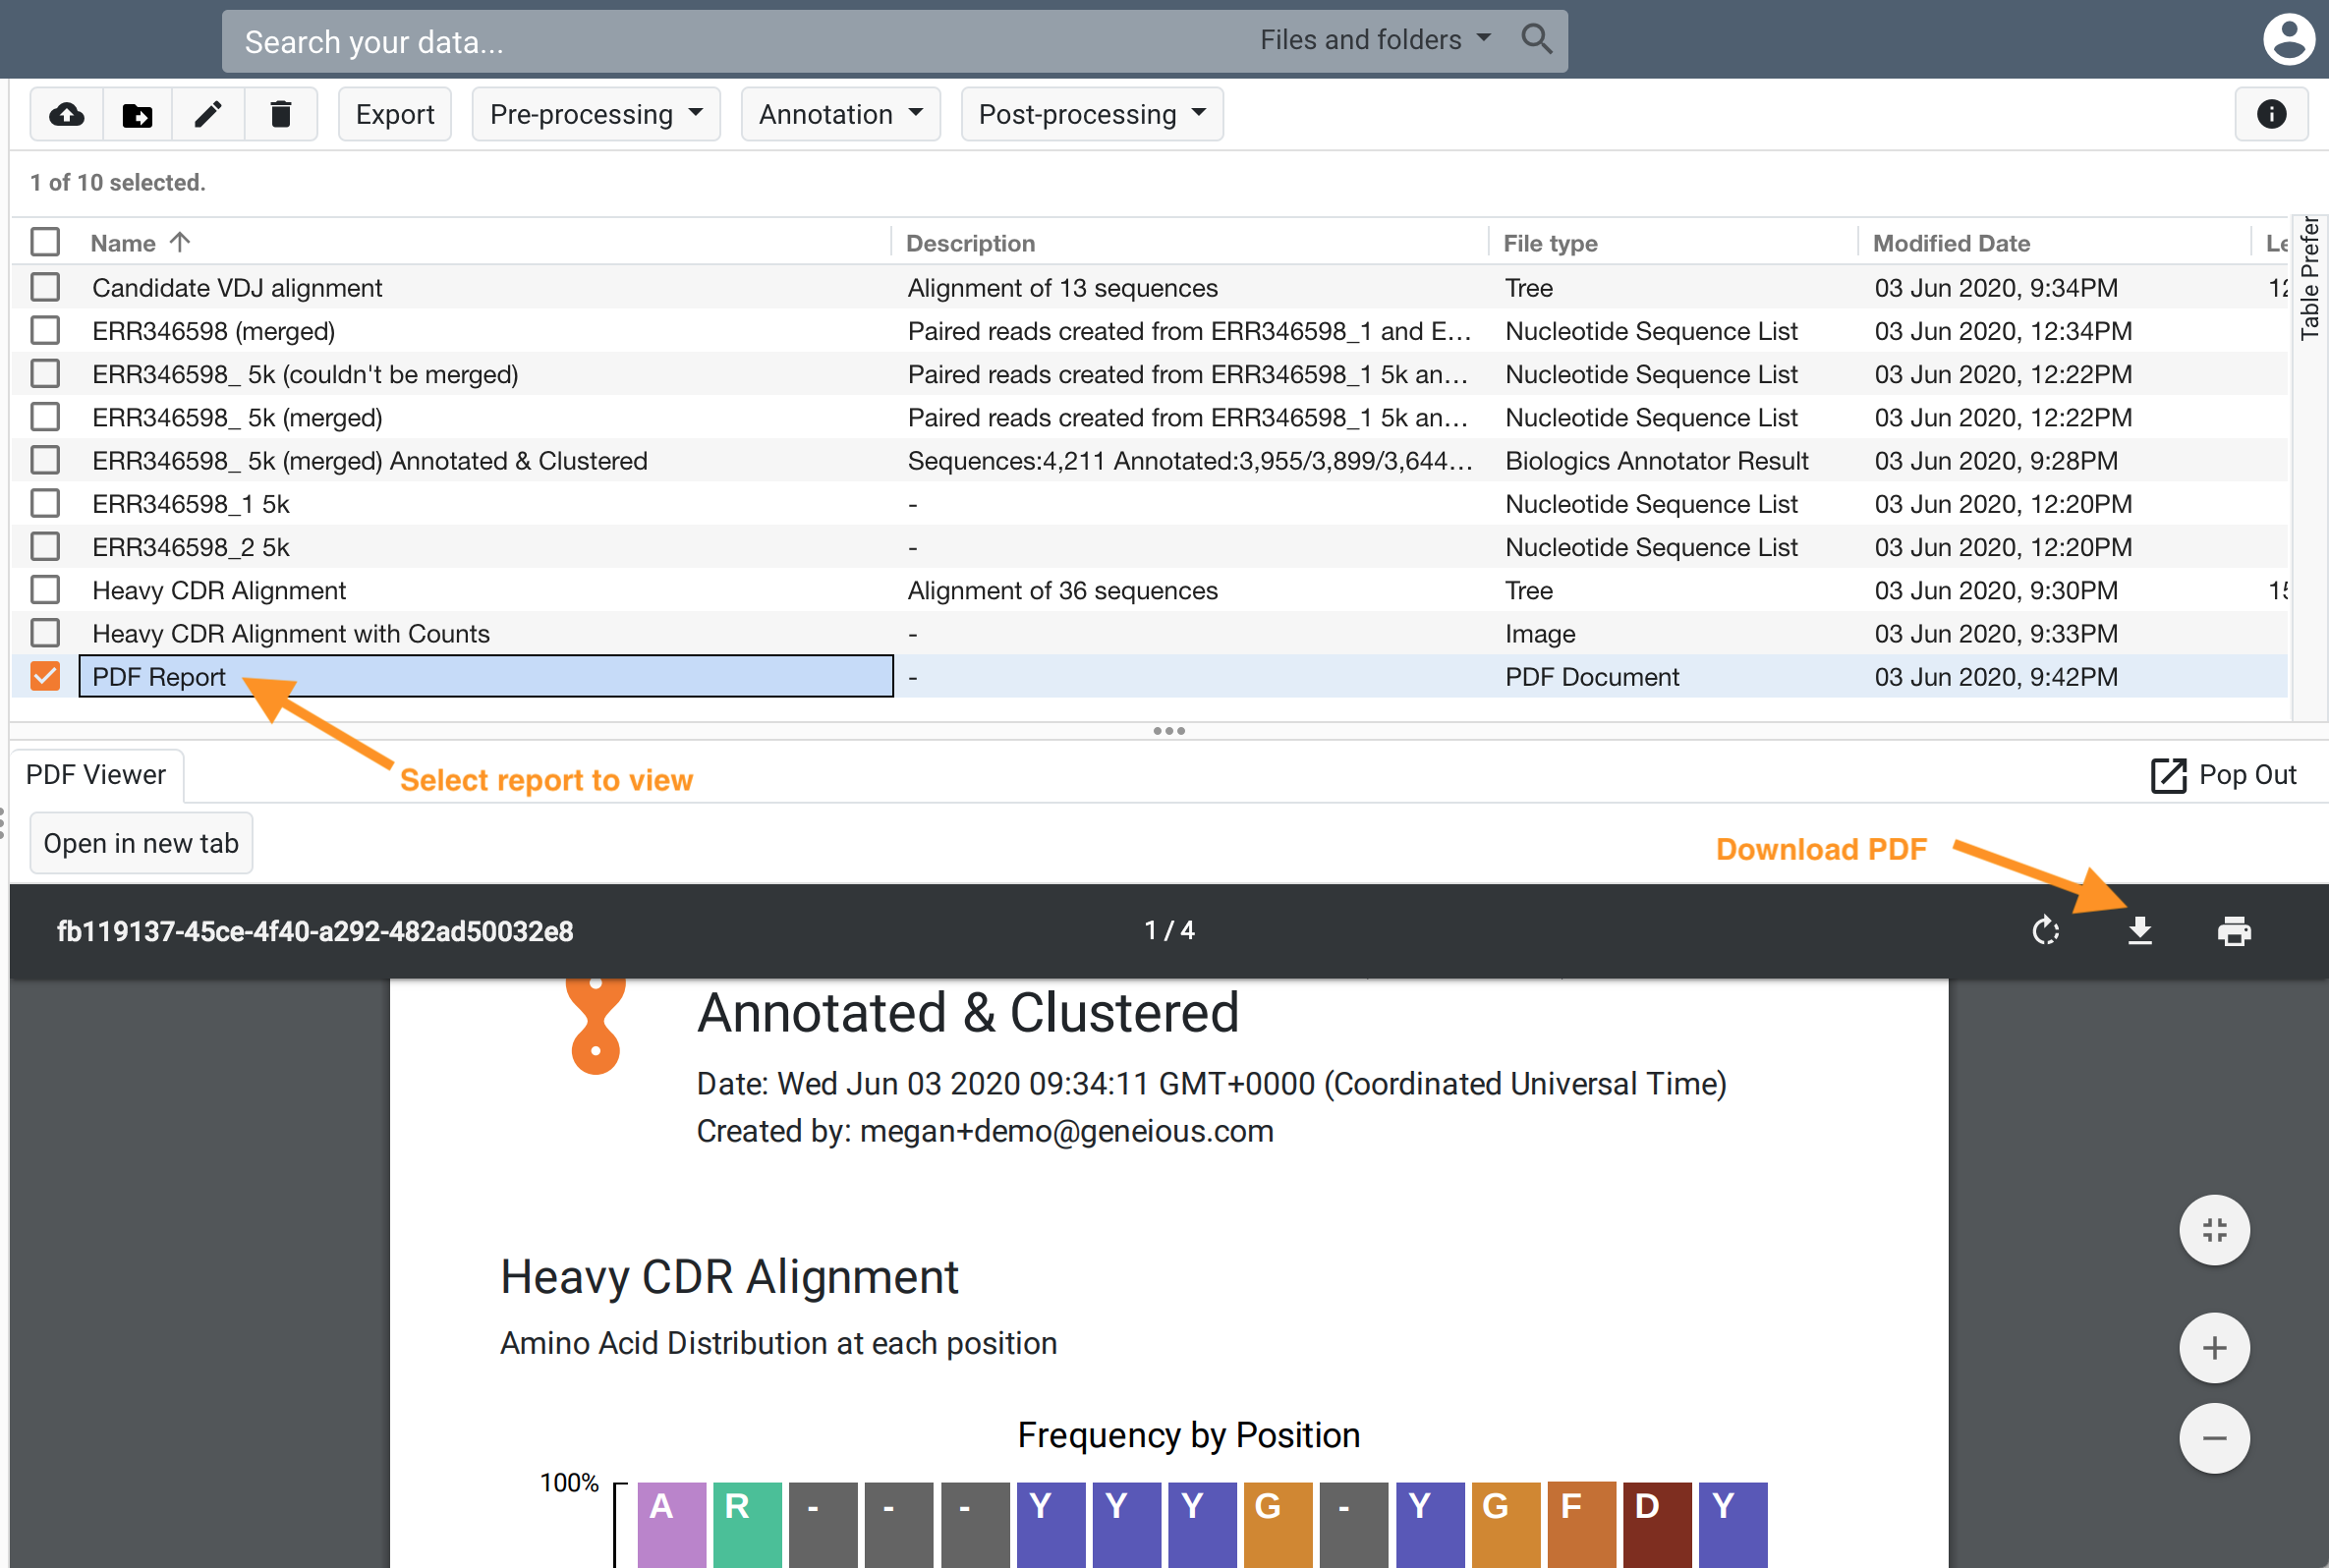
Once you've added and tweaked your desired report format using your chosen widgets, click Create and a new report creation job will start. Once the Report job has completed, a new PDF document will appear in the same folder as your annotated result. The report PDF can be viewed in Geneious Biologics. Reports can also be downloaded within the inbuilt PDF viewer for transfer to ELN or other record systems.
Types of Widgets
Result Table Widgets
The Result Table Widgets gives the ability to display any table from your Annotated Result. First selected your desired table in the right-hand panel, and then you may choose a Table Preference Profile to apply a saved column format to your table. From there you can reorganise the columns as desired, by sorting, reordering and resizing your columns. Columns can be dragged to reorder them. To resize, hover your mouse over the border between columns until you see the resize icon, and then drag to resize. To sort on a column simply click on the desired orange column header.
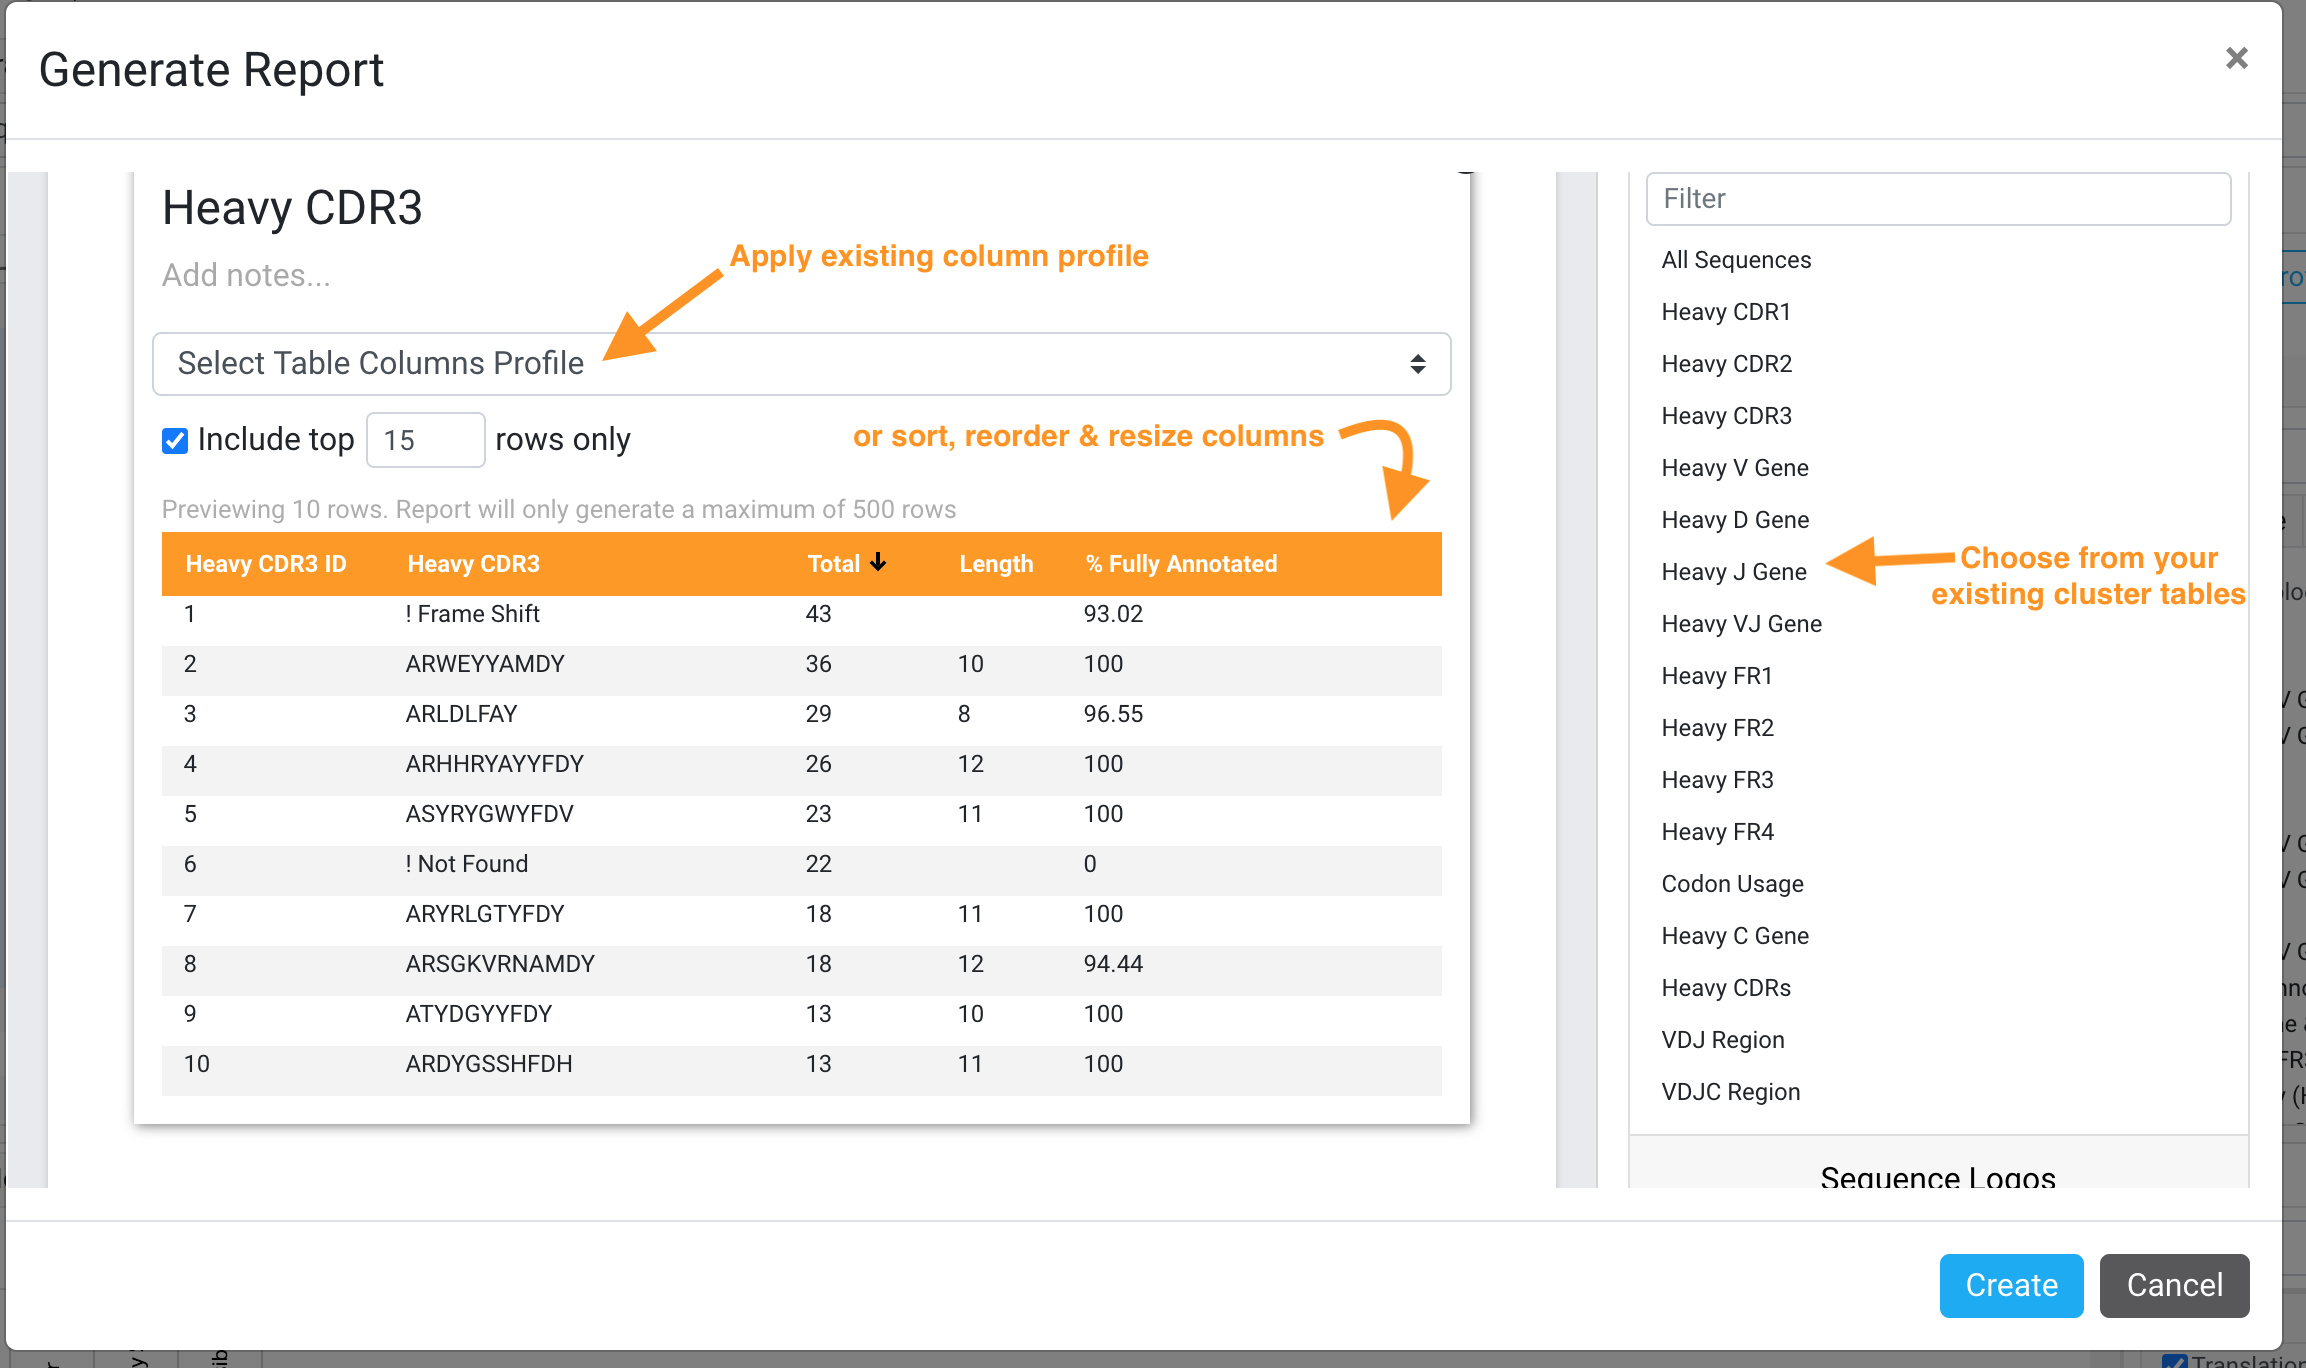
The "Include top X rows only" option determines how many table rows will be displayed in the final report. This takes column sorting into account, for example in the image above the top 15 rows with the highest "Total" will be included in the report. The report will only ever include a maximum of 500 rows. For ease of viewing only the top 10 rows are displayed in the preview.
Please note that the table needs to fit on an A4 sized page (similar to Letter size) for the resulting Report PDF. This means that the table width is limited so only the left-most columns will be displayed in the report. If you wish to display more columns, you can add the same cluster table to the report a second time and add apply a different column profiles to your second table widget.
Custom Table Widgets
Some pipelines have additional custom statistics tables available to display in the report. One example is the Motif Analysis post-processing pipeline.
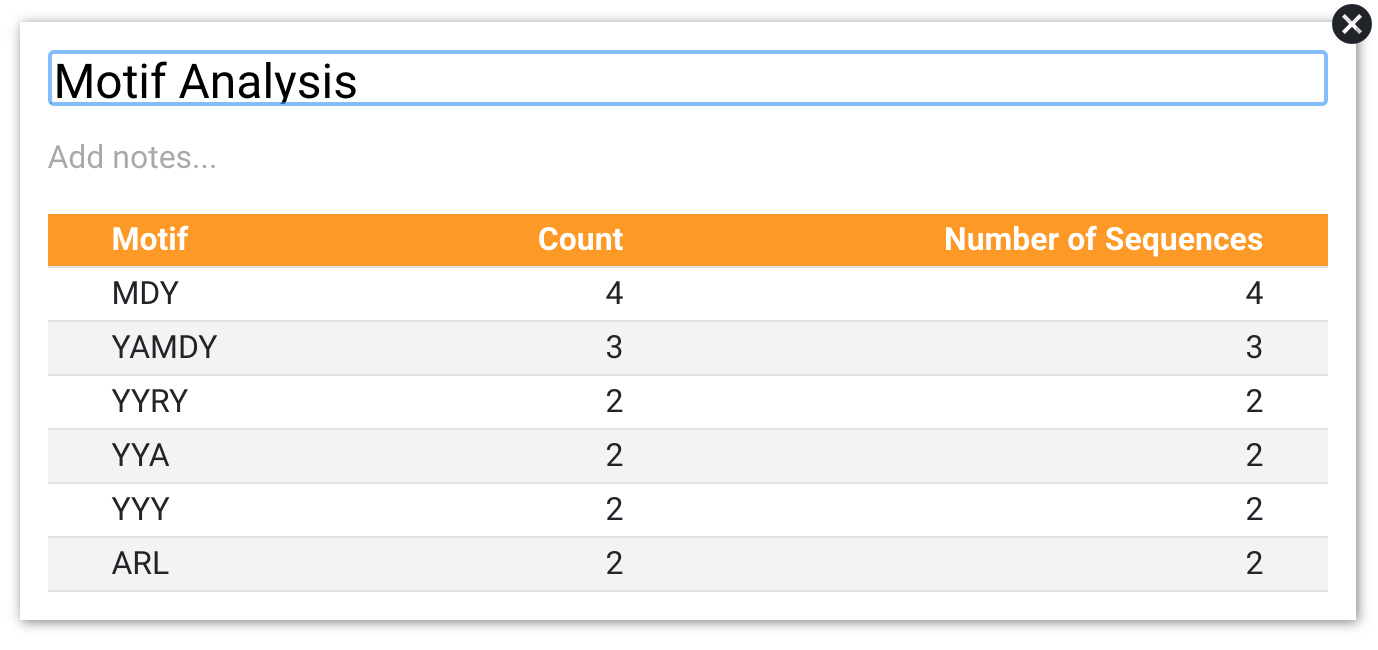
The Motif Analysis statistics table will only appear if you have run the Discover Motifs post-processing pipeline on your result.
Sequence Logo Widgets
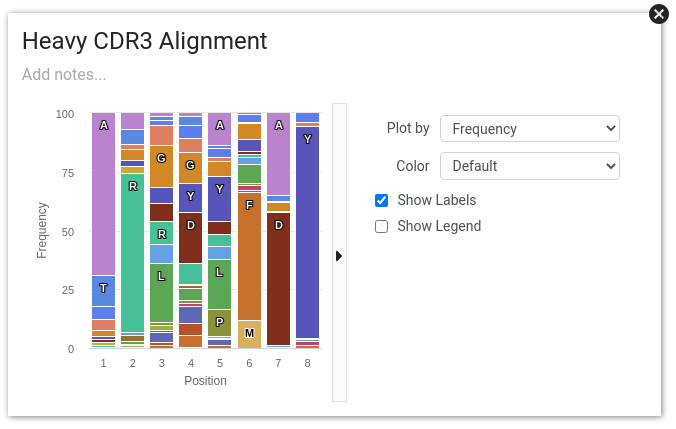
The Sequence Logo Widgets will only be available if you have produced any alignments of sequences or clusters from your current analysis result. The report builder will automatically know which alignments are associated with your current analysis, and these will be available for selection. In addition, you can also include the sequences from your alignments of interest - see "Image Widgets" below for further information.
Graph Widgets
The Graph Widgets give the ability to display different types of Graphs based on different statistics from your Annotated Result. These are the same graphs displayed in the Graphs tab viewer, and will only be available for analysis results created using Antibody Annotator.
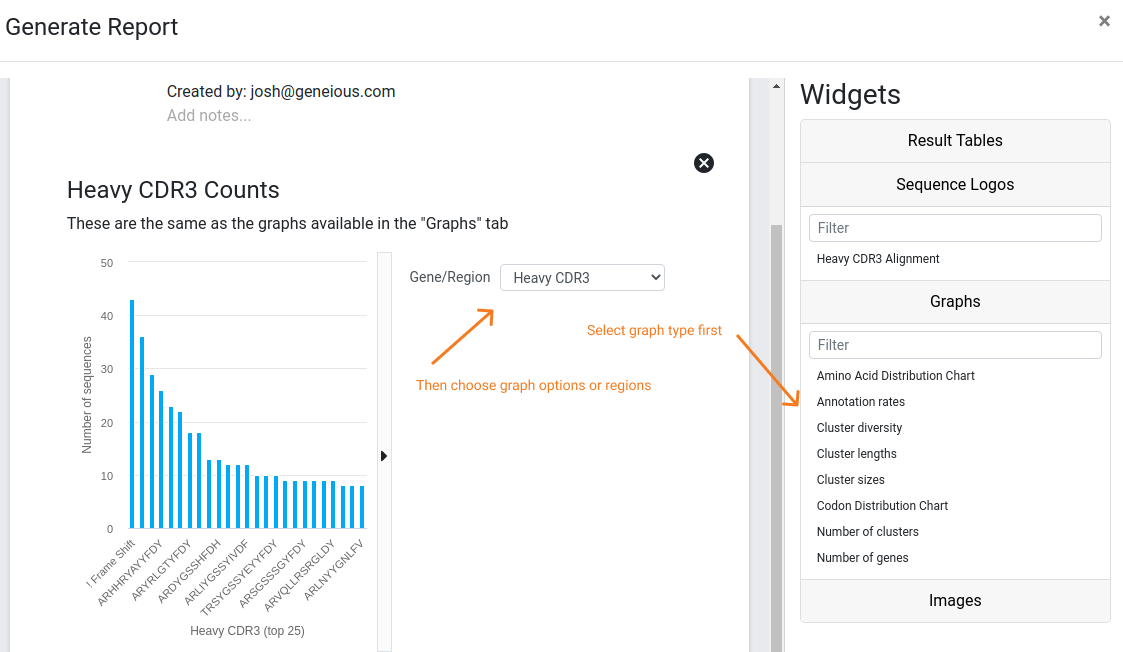
Image Widgets
Any "Image" type files in your folder can be used for displaying in the Report. These could be images that you have created by exporting an image from the Sequence Viewer of annotated sequences or alignments. You could also upload other JPEG or PNG images related to your analysis. Any images in the same folder as the analysis result can be added to the report.
Including a Sequence Viewer Image in your Report
As mentioned above, reports can include images of Sequence lists, Alignments, or selections of annotated sequences. This is done by exporting an image from Biologics Sequence Viewer into your files table, then adding that image as a widget into your Report via the Generate Report dialog. Before creating the images you can customise your zoom level, assay data displayed alongside the sequences, and any other sequence viewer options. These will be preserved in the resulting image.
To include a Sequence Viewer snapshot:
- Find a Sequence/Sequence List/Alignment in your files table that you want to include within your Report.
- Select that Sequence document and fine tune the visual aspects of the viewer to how you want it to look (e.g. zoom level, pick your colour scheme, choose annotations on or off etc). The Export image functionality will export ALL sequences, even if you can’t see them in your view.
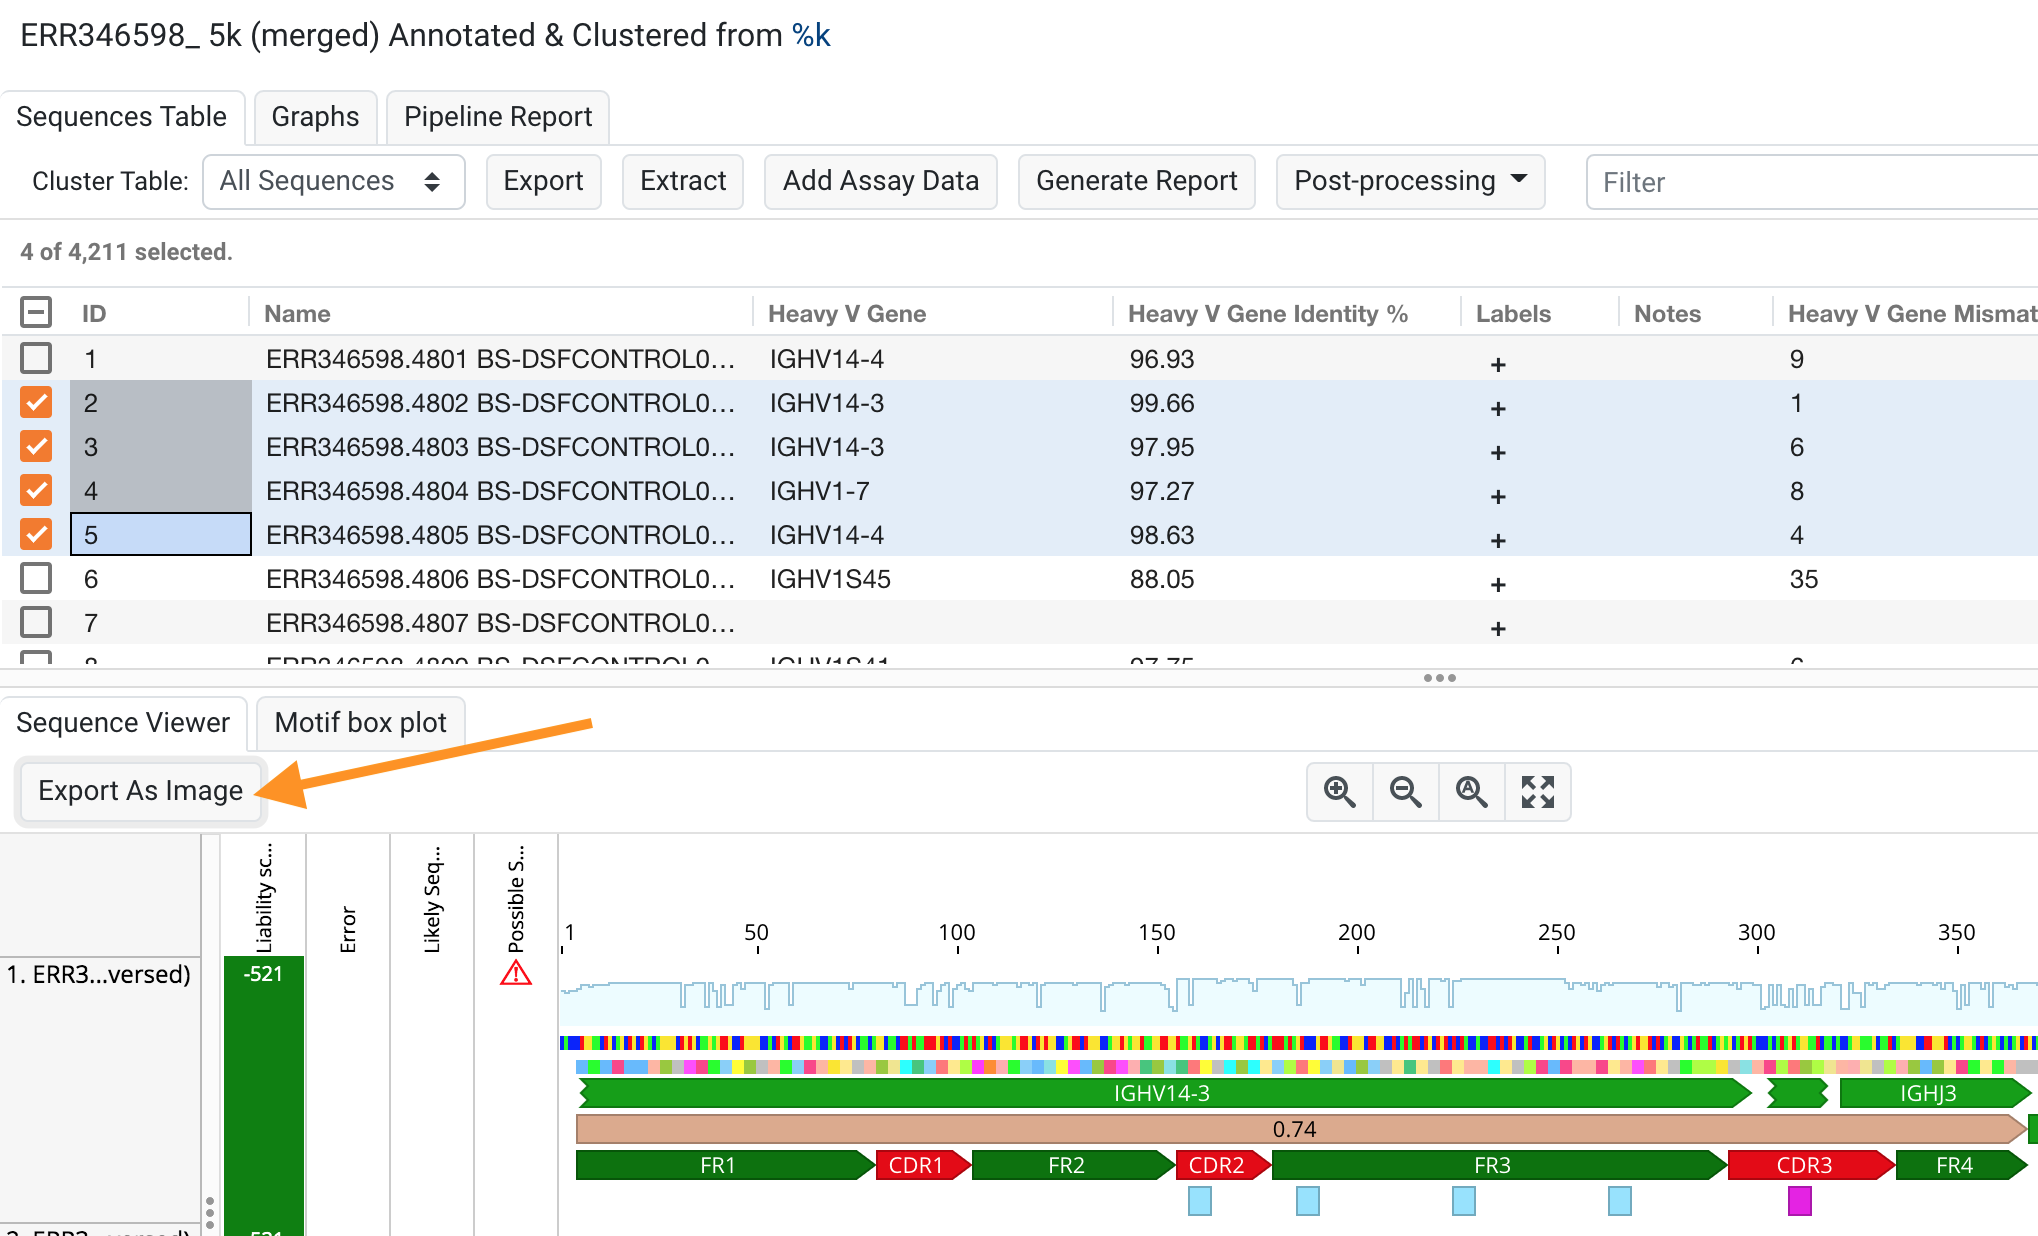
Examples: Exporting sequences directly from a result document (above) or all the sequences from an alignment (below).
- Click Export As Image, name it how you like (this will affect its title in the report) and click Export.
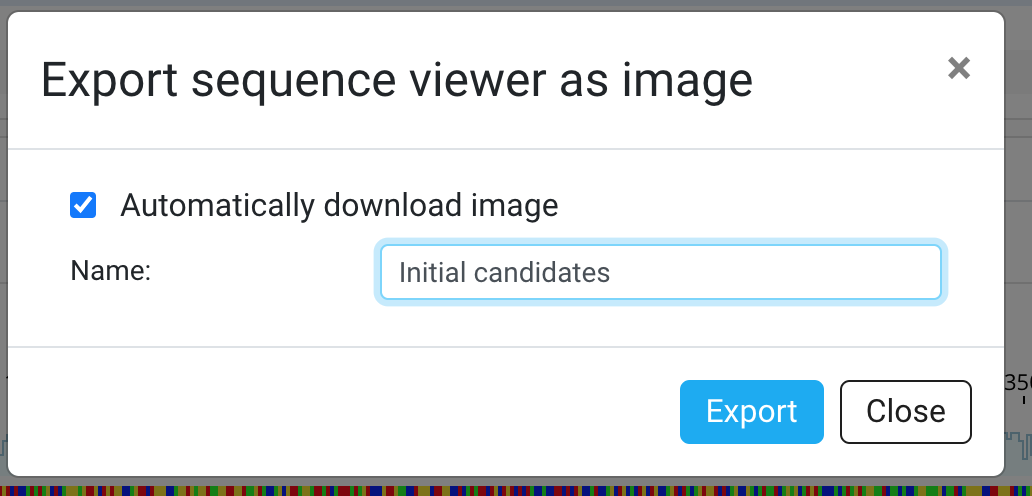
- Once that has been completed, you will notice there is a new image in your files table. Select it and make sure it looks how you expect.
- Now go back to your Annotated Result and open the Generate Report dialog. In the Widgets panel on the right under Images you will notice that you can now select your image for inclusion into your Report.
